


Expanded Curves
Figured a take a minute and let everyone know what I’m working on at the moment. I’m wrapping up work on expanding the concept of curves to include temperature data collection.
Turns out there are a lot more people using thermocouples than I thought. For them, the concept of roasting curves is a little lacking. Curves were designed to provide a way to record the settings you adjust throughout a roast – i.e. roaster controls. I had always planned on implementing temperature reading curves in addition to control curves, it was just a little further down on the list (along with a full screen graph – more on that in a moment). I’ve received a lot of email feedback on the subject, and happy to report that temperature curves are now my main focus.
So… thanks to everyone for the email feedback – and suggestions. The next update is close to being done. Unfortunately, Apple is closing the iTunes Connect portal that developers submit to on Thursday, and it won’t reopen until the 28th. I should be able to submit the update after that. Then we’ll just have to wait through the usual approval process – probably a week.
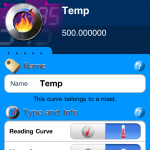
So, what’s new? Temperature reading curves, mainly. They can operate in either Celsius or Farehnheit, and are the same entities as the existing control curves. They can be assigned to profiles, programs or a roast. They only two main differences beyond the existing control curves are: they are exempted from past roast matching (since they are readings and not controls) and they graph as a standard line graph (connect-the-dot style as opposed to stair-stepped style). If you’ve been entering your temperature readings in curves as you roast – all you’ll have to do is tap a toggle switch on each of these curves to convert them to the new temperature reading style.
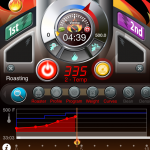
If you’re left wondering how you’ll fit all those readings on the minimal screen real estate of the graph, don’t worry. Help is on the way. This is going to have to be accomplished over the course of a couple of updates. The upcoming update will introduce a preference setting for the default graph time. This is an interim solution for those anxious to start collecting temp data. You can set the graph to display any interval from 1 to 30 – and should go a long way to eliminate node-congestion on the graph for shorter roast times.
After this update, I want to turn my attention to creating a full screen graph. A zoomable and pan-able graph that will take over the screen whenever the device is rotated to the horizontal orientation. I think this will be a fast and intuitive way to clear the screen of the details of a roast and let you concentrate on the data. This has been in the plans for Roastmaster since the beginning – it’s exciting for me to finally be to the point of making it happen.
Here are a few screenshots from the upcoming update.

As always – let me know your thoughts on Roastmaster.
Danny![]()


Leave a Reply