
Roast Intelligently
Knowledge yields acumen. Roastmaster’s broad suite of roasting tools will help you easily build, track, monitor, target and log each and every roast. And, Roastmaster’s informative interface displays the sum of all that knowledge with just a tap.

You Plot the Course
Whether you track only milestones, or multiple temperature curves while targeting one of your custom profiles, Roastmaster is eager to appease. It accommodates your own unique workflow–making it easy to track the data that is important to you.
Setup is a Snap in the Roast Console
When you create a roast, simply tell Roastmaster what beans or blends you’re roasting, and their green weight. If you want to record values to control or reading curves, add them here with the curve button. Or, better yet–tag one of your custom profiles containing these reference and data curve templates already configured.

Let Your Past Roasts Be Your Guide
It’s helpful to have some basic milestone data to reference as you roast. This is what the console graph is designed for! Just tap the criteria buttons below the graph to load roasts that are similar to the current roast. Choose by bean, country, profile, roaster, moisture, density, and many others. The milestones from the matching roasts will provide a helpful graphical means of timing and gauging your current roast.

Ready, Set…Charge!
Just tap the start button as you charge the roaster, and you’re off…Roastmaster’s gauge will begin tracking time. It uses the same milestone data displayed in the graph to calibrate its end time to either first crack, second crack or a drop time for a specific roast degree. The progress needle shows you at a glance how close you’re getting to these milestones. And, since this is drawn directly from your own data, the gauge becomes smarter the more you use Roastmaster.

Snap, Crackle, Pop!
To record crack data, just tap the corresponding crack buttons. The first tap sets the start of that crack phase, while subsequent taps add to the duration. Long tap a button to clear the crack data.

See the Bigger Picture in the Roast Analyzer
As helpful as the roast console is, it’s geared toward a simple style of roasting–relying on milestones for roast timing. If you work with curves, and want all the bells and whistles (and the screen real estate to boot), tap the analyzer button to launch the roast analyzer. Here you’ll find all the tools you need to view, target, monitor and input or edit data as you roast.

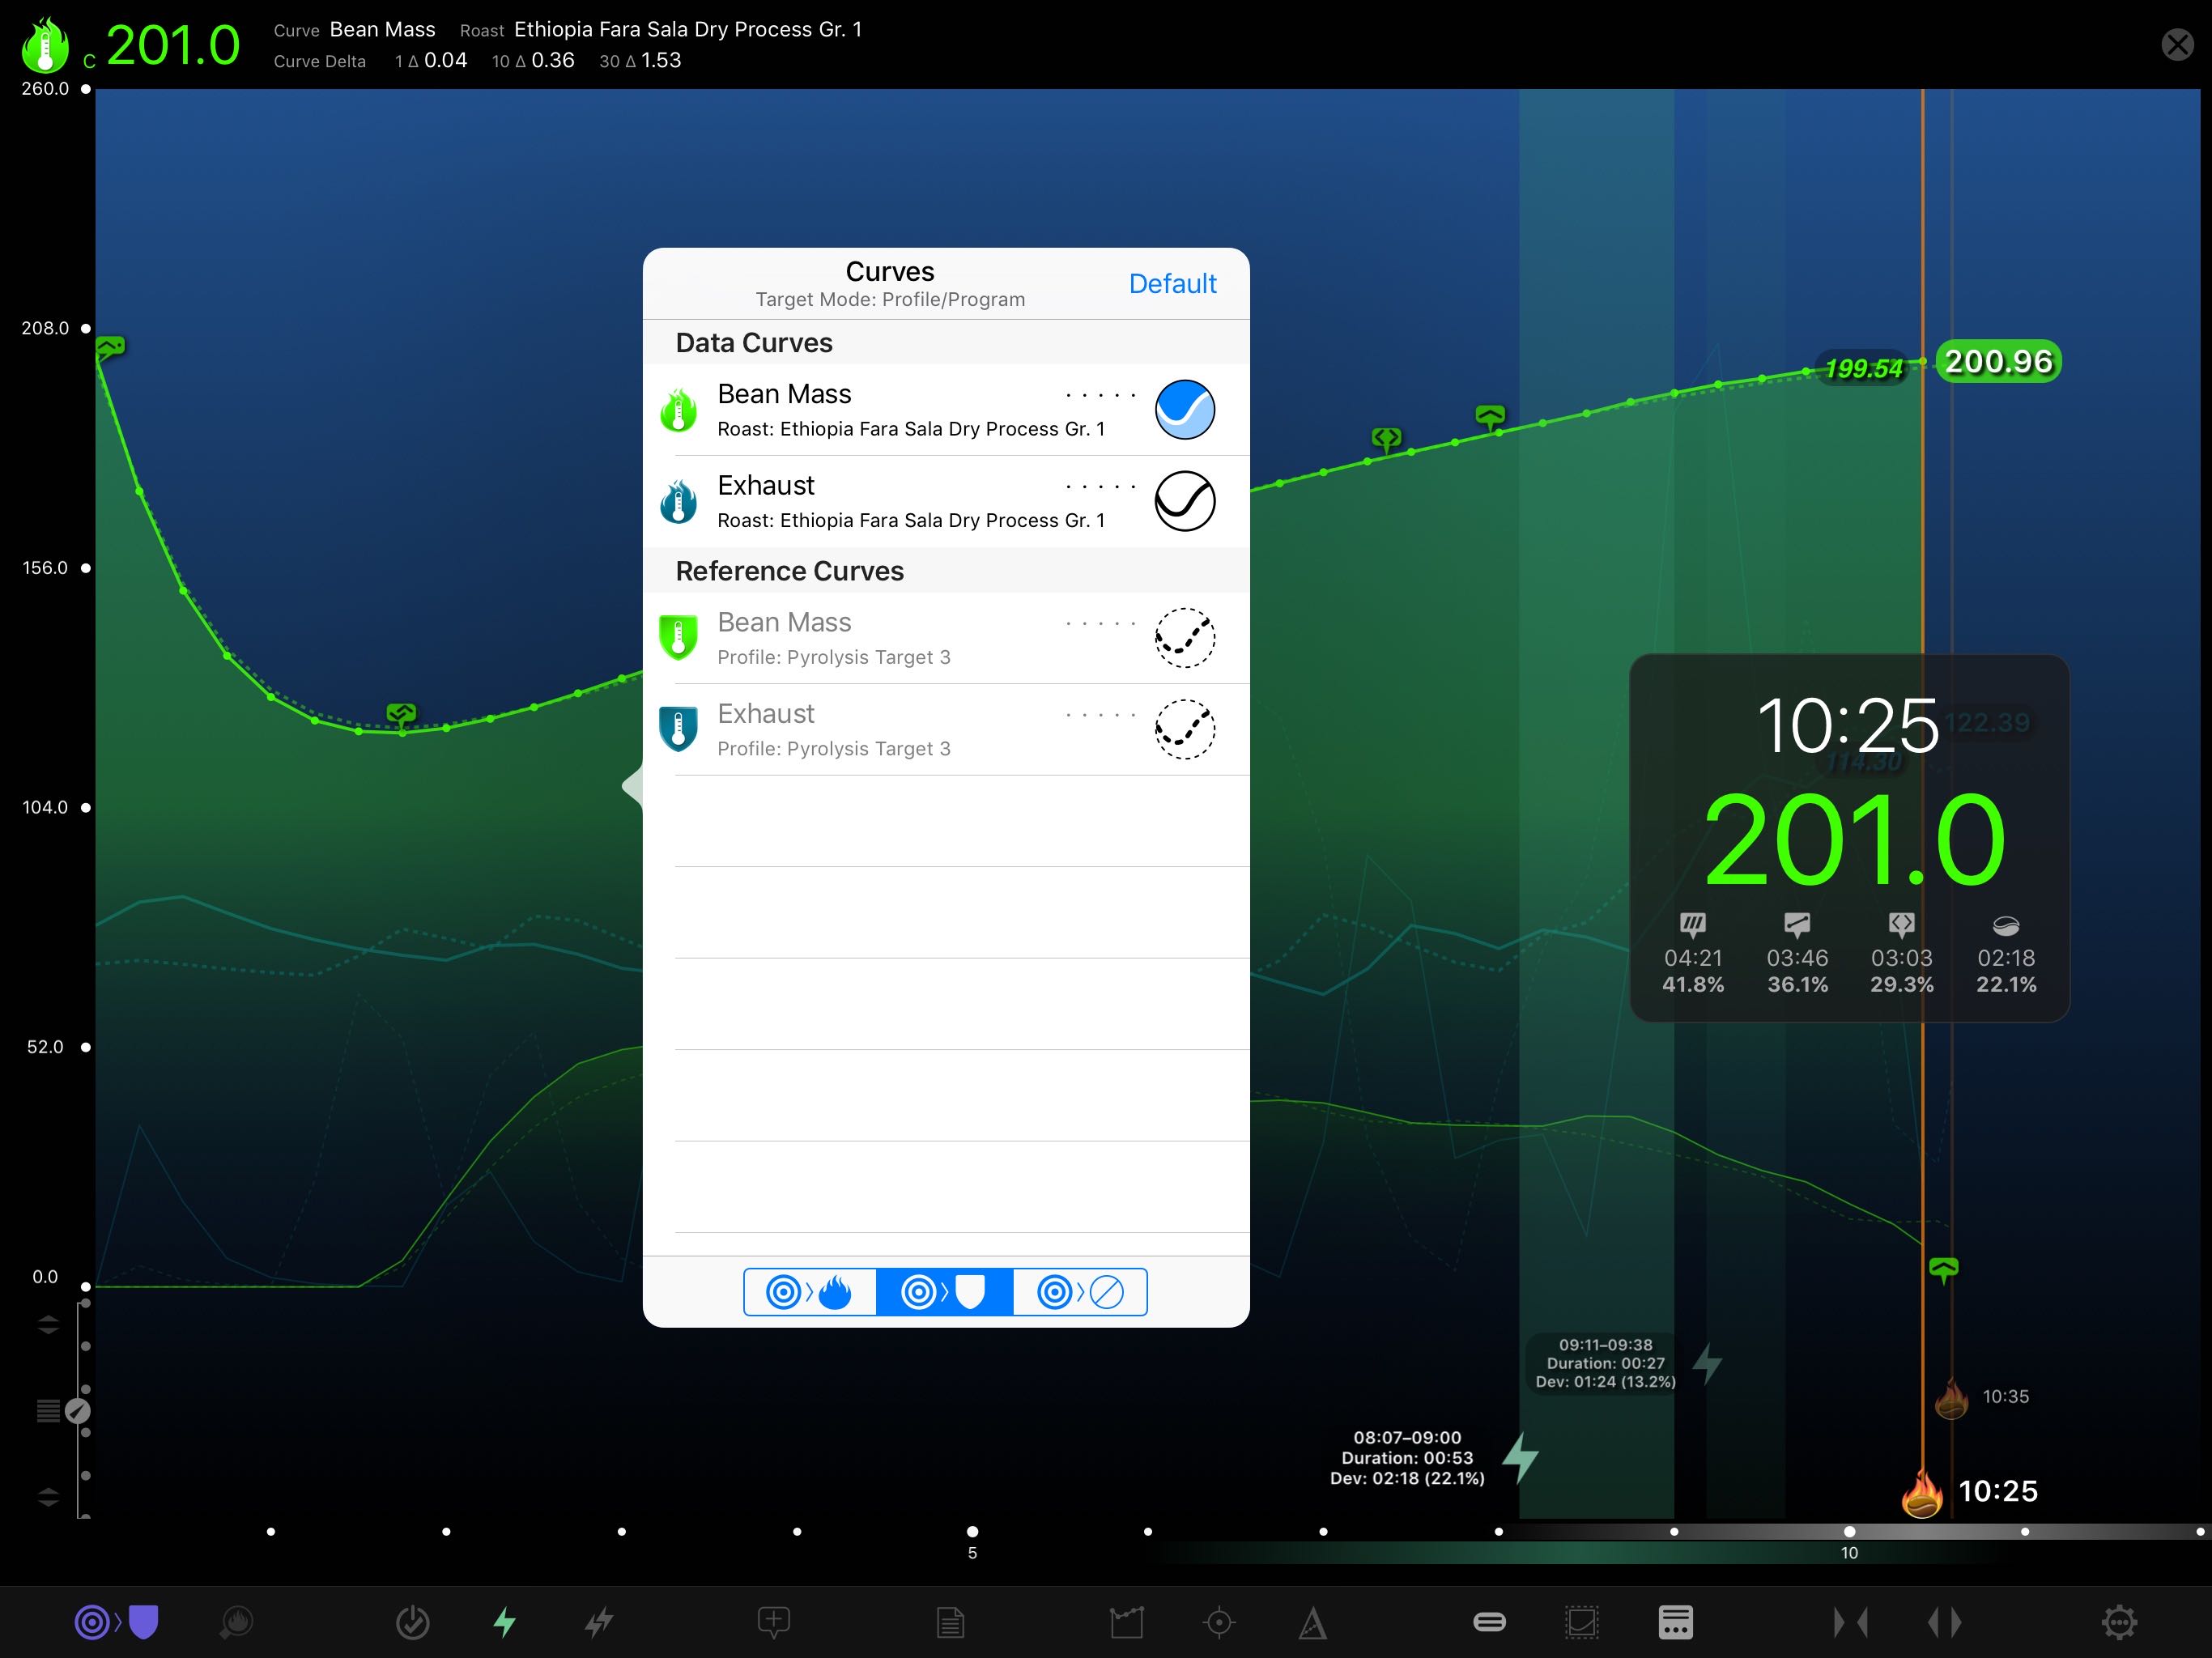
Control and Reading Curves Plot the Map
When recording variable data in Roastmaster, you can choose either a reading curve or a control curve. Reading curves hold temperature readings, while control curves hold roaster control values, such as gas flow, air flow or damper setting. Each provide a unique means of recording exactly how a roast was performed, and can work together in a profile to provide a detailed map for your future roasts.

Easily Record Data
Just tap the digital readout to record a new temperature or control value to a selected curve. Roastmaster will create a time-stamped node at that point in the roast. Too much work? Well, consider the Automatic Data Logging option with a wireless thermocouple and let Roastmaster do it for you.

Get Closer to Your Data–and Interact!
Zoom, pan and interact with every element of your current roast, as well as the profile or past roast you’re targeting. Switching targets is easy – just tap the targeting button. When targeting past roasts, swipe your finger along the bottom axis to quickly find the roast you want.

Monitor Temperature Deltas and Delta Curves
Roastmaster provides several means to view not only the past behavior of a temperature curve, but also the current and even predicted future behavior as well. Customizable delta values along the top of the analyzer show the recent rate of rise for three different time intervals. And, delta curves show the entire history of rate of rise for temperature reading curves.

Know Where Your Temperatures Are Headed
Tap the temperature projection button for any curve to see a differential prediction of where that curve is headed. Roastmaster analyzes the current rate of rise, and factors that differentially with the recent behavior of the curve to predict a future temperature. Projection markers stay locked to a point in time ahead of the current time. Drag the marker to move it closer or further away.

Employ Events for Temperature Related Alerts
Events mark when and where an action occurs–either in a curve, or the roast itself. They can function as simple annotations, or complex auto-trigger alarms–letting you know when a certain time or temperature has been reached. They are a sophisticated alternative to control curves, that make your profiles more portable for other roasting machines.

Bagging While Roasting?
The analyzer’s HUD (Heads Up Display) shows the vitals of of your roast, and its large fonts can be viewed from a distance. Drag it around to reposition it anywhere on the screen to stay out of the way of important curve information. It also keeps a running tally of your drying, ramp, pyrolysis and development times.
