Connect the Dots for Insight
Having the best visual understanding of your data…the best picture…helps you make the best choices. These choices shape the quality and taste of your coffee. And, if you’re a coffee business owner…shape the growth of your business.

Coming soon in Roastmaster iOS 26
Capturing the Best Picture
Just like a camera uses different lenses to capture the best photograph, Roastmaster’s Analytics Suite has varying ways of viewing and comparing your data. These lenses, so to speak, are each capable of composing a different picture…all designed to capture the most informative perspective possible. They show you how individual elements of your data relate to other elements…both big and small.
Analyze
Roastmaster’s Analyze features are the perfect wide-angle lens to get the big picture of your data.
They provide an encompassing bird’s eye view of your items–and help identify patterns, potential and possibilities.
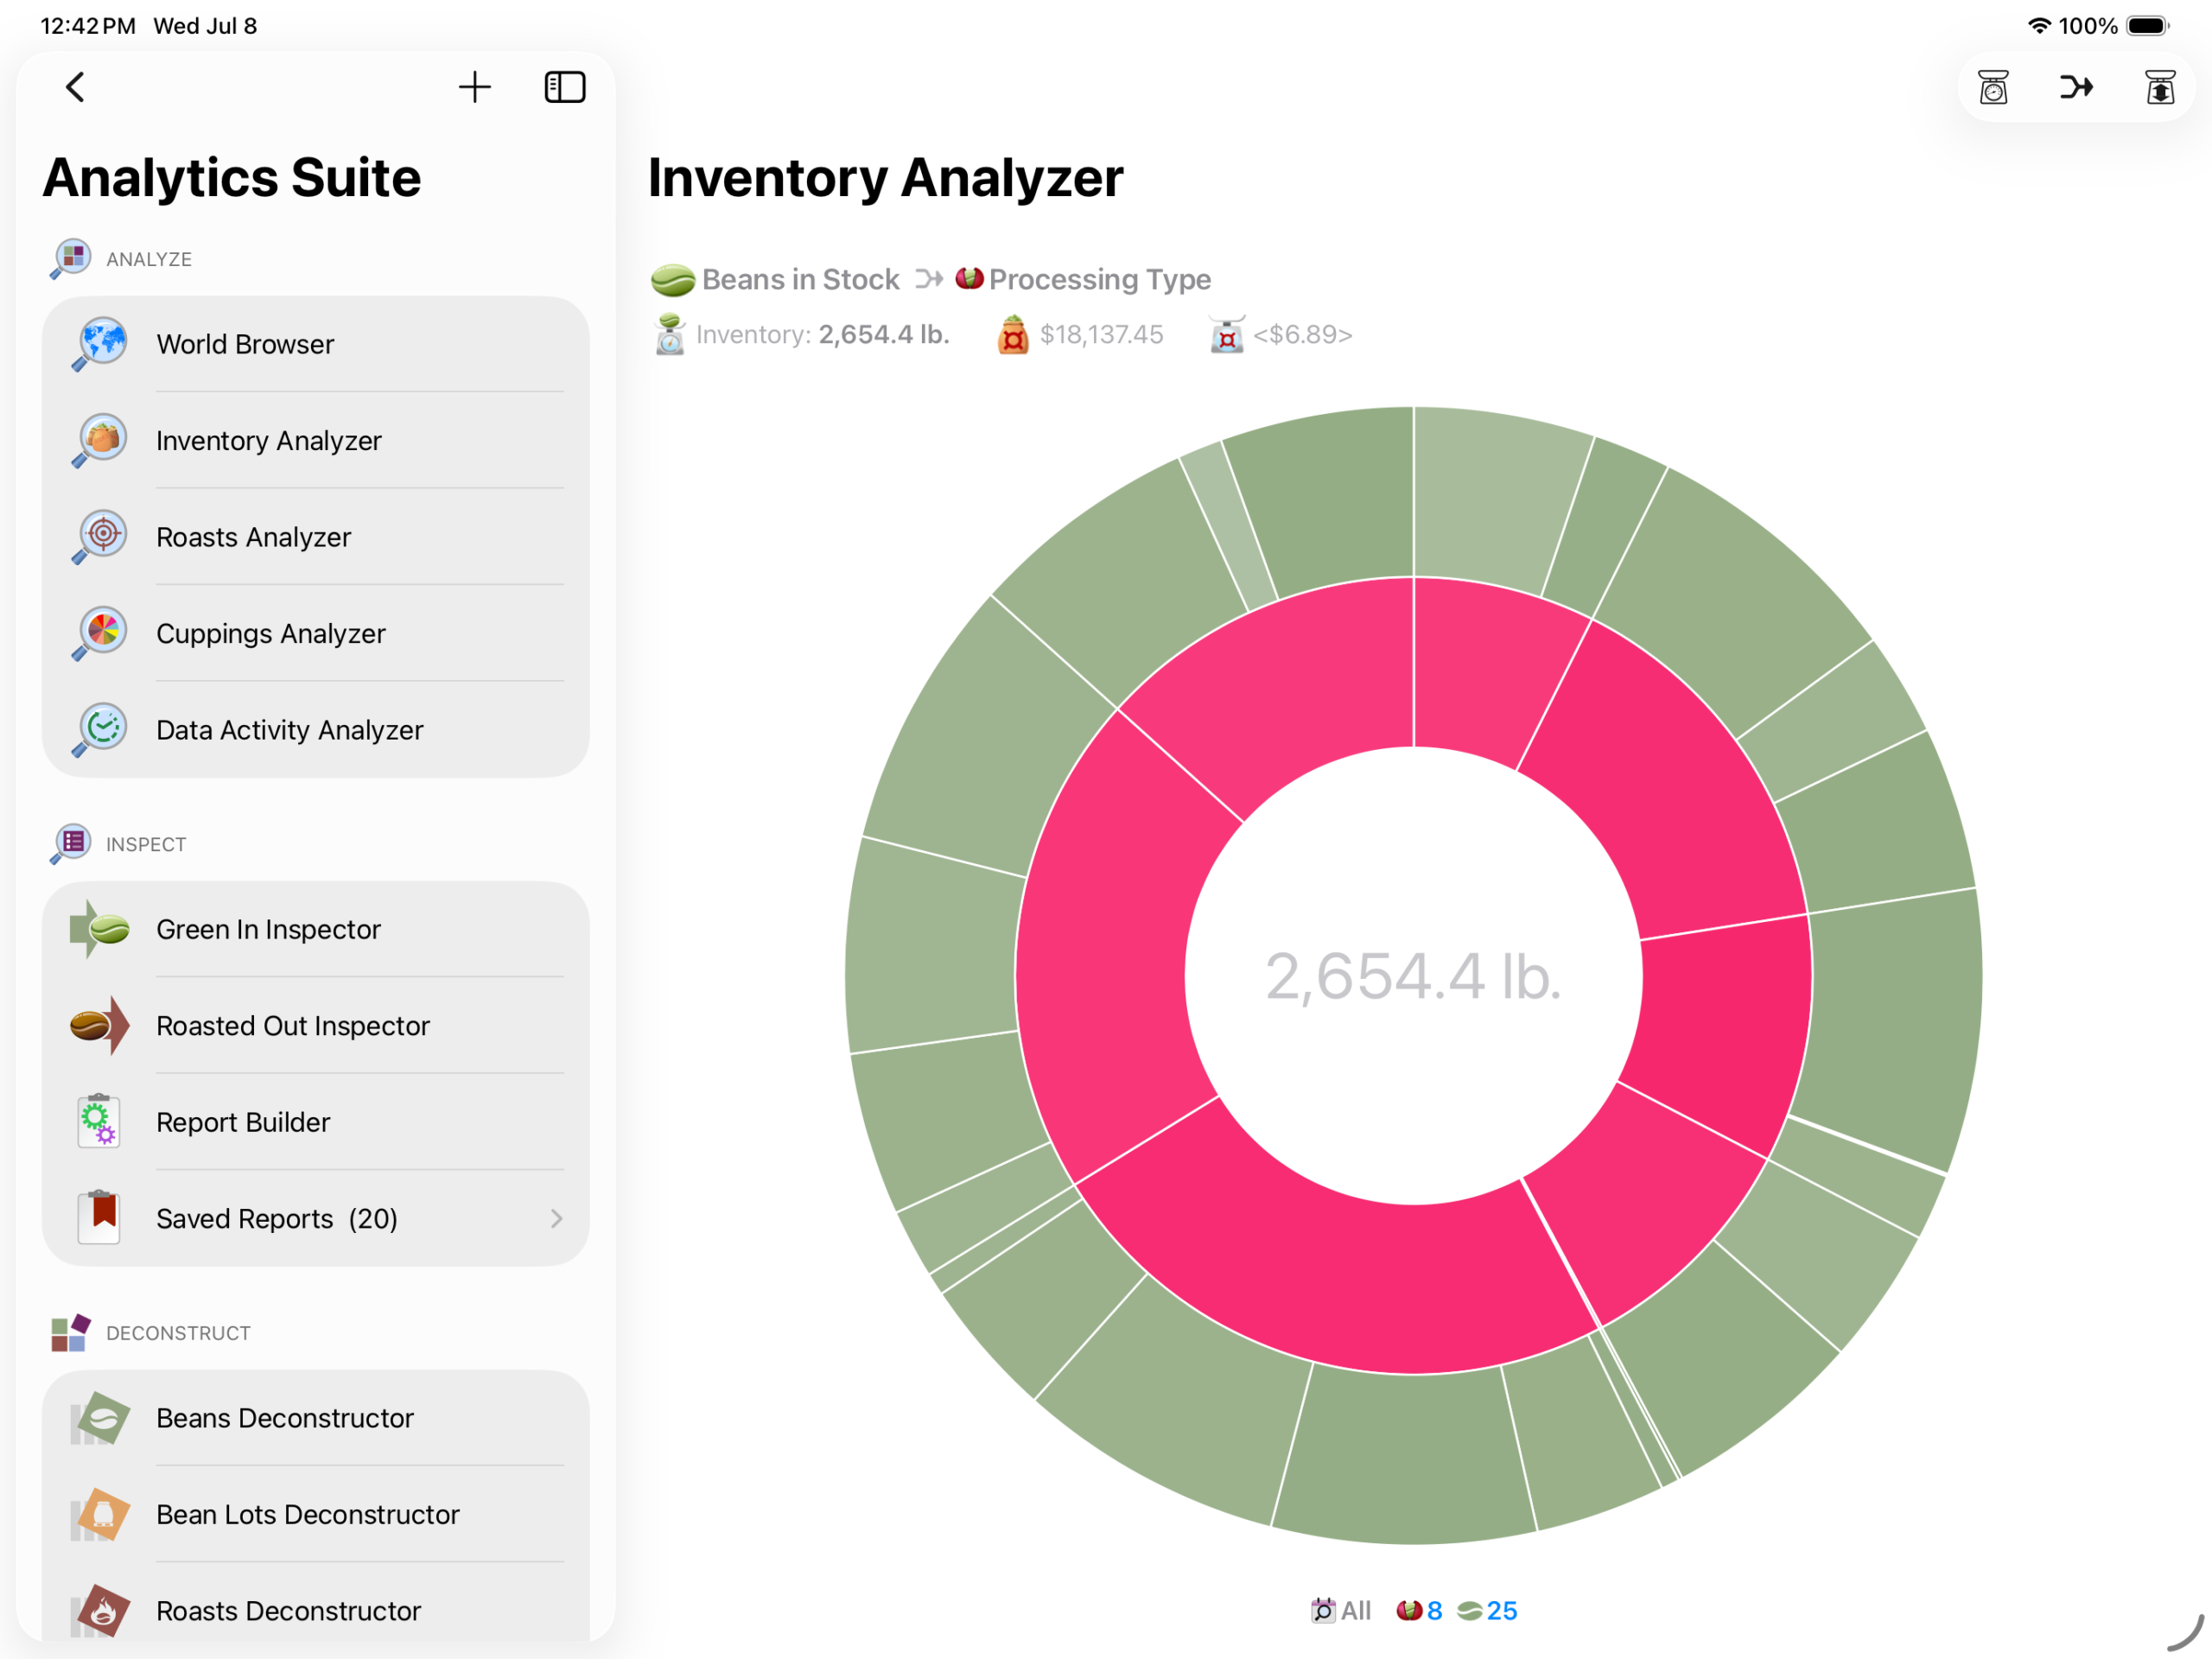
Inventory Analyzer
The Inventory Analyzer makes it easy to see every aspect of your inventory at a glance, grouped by bean attributes.
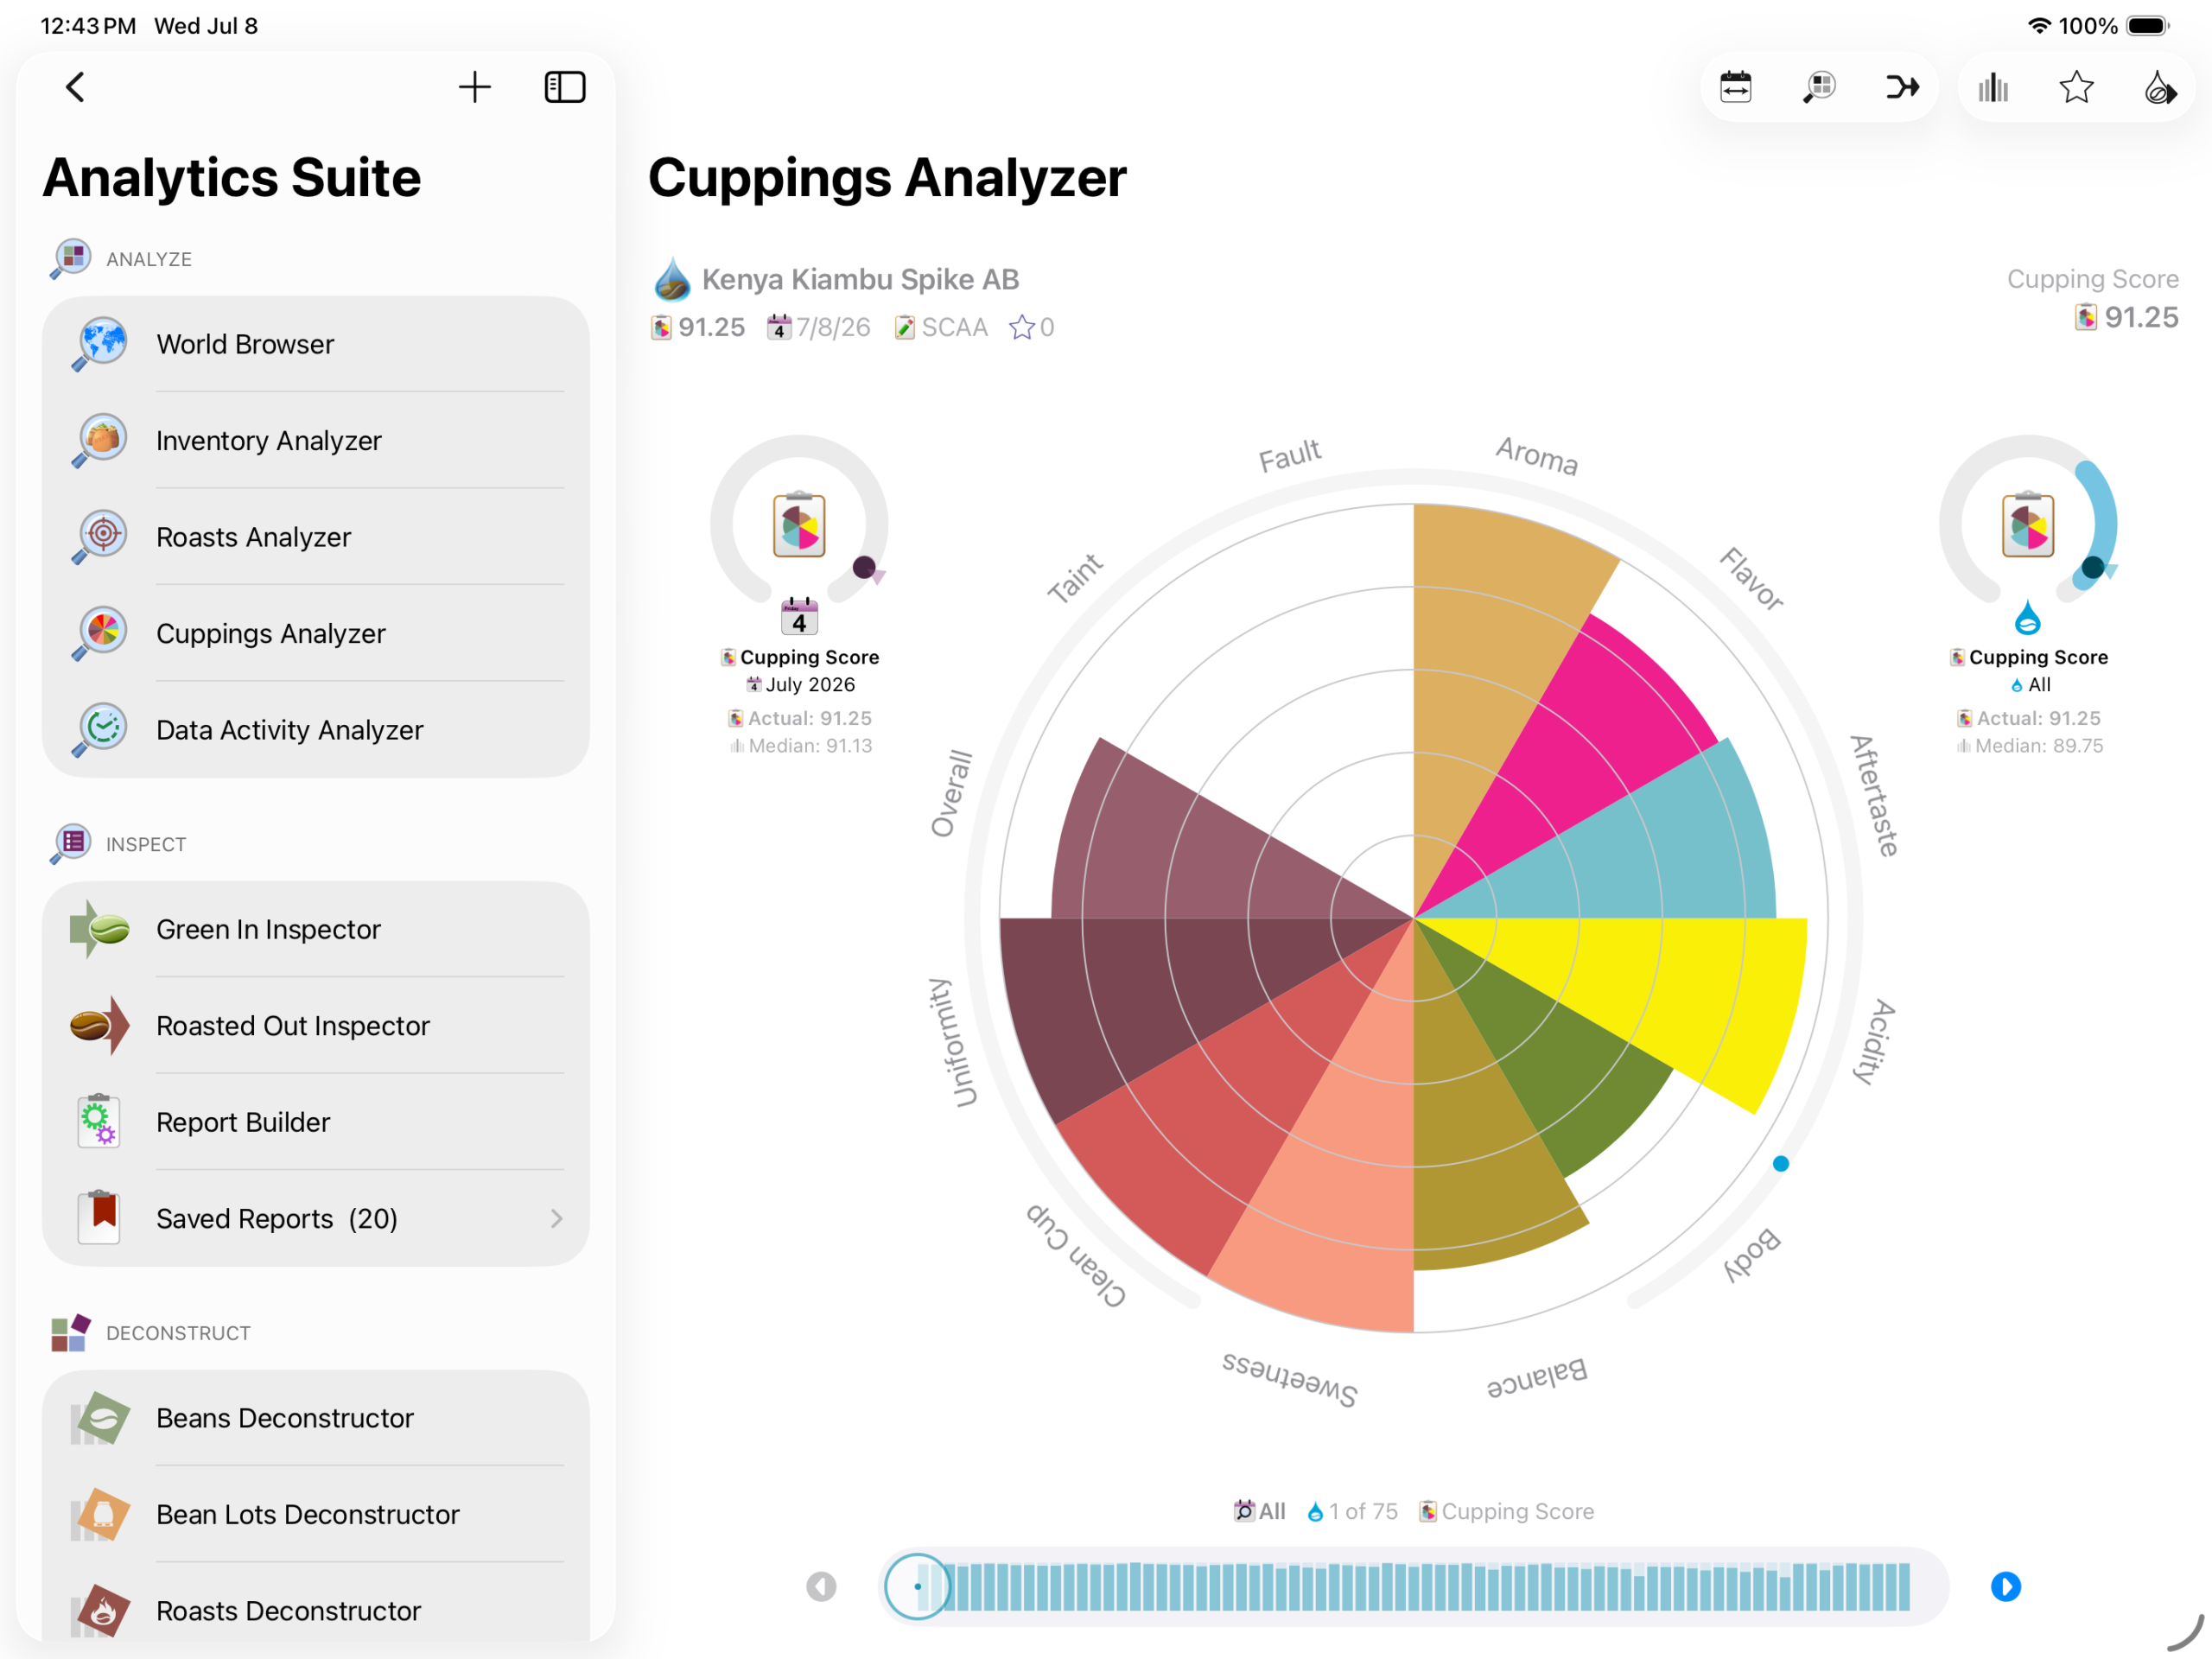
Cupping Analyzer
Roastmaster supports several, task-oriented cupping protocols. The cupping analyzer displays all of these with a unified color palette, designed to help you track certain attributes among every protocol.
Data Activity
The Data Activity Analyzer shows the number of new elements added to your database, and can be grouped in chunks of years, months, weeks or days.
Inspect
Roastmaster’s Inspect features are the perfect flexible zoom lens to capture many types of pictures of your data.
Capable of zooming out for the big picture, and back in for a look at the small details, they bridge both the macro and micro worlds together.
Report Builder
The Report Builder allows you to create, configure and run a custom report.
Tap the + button to save this report to your database for instant access in the Reports section.
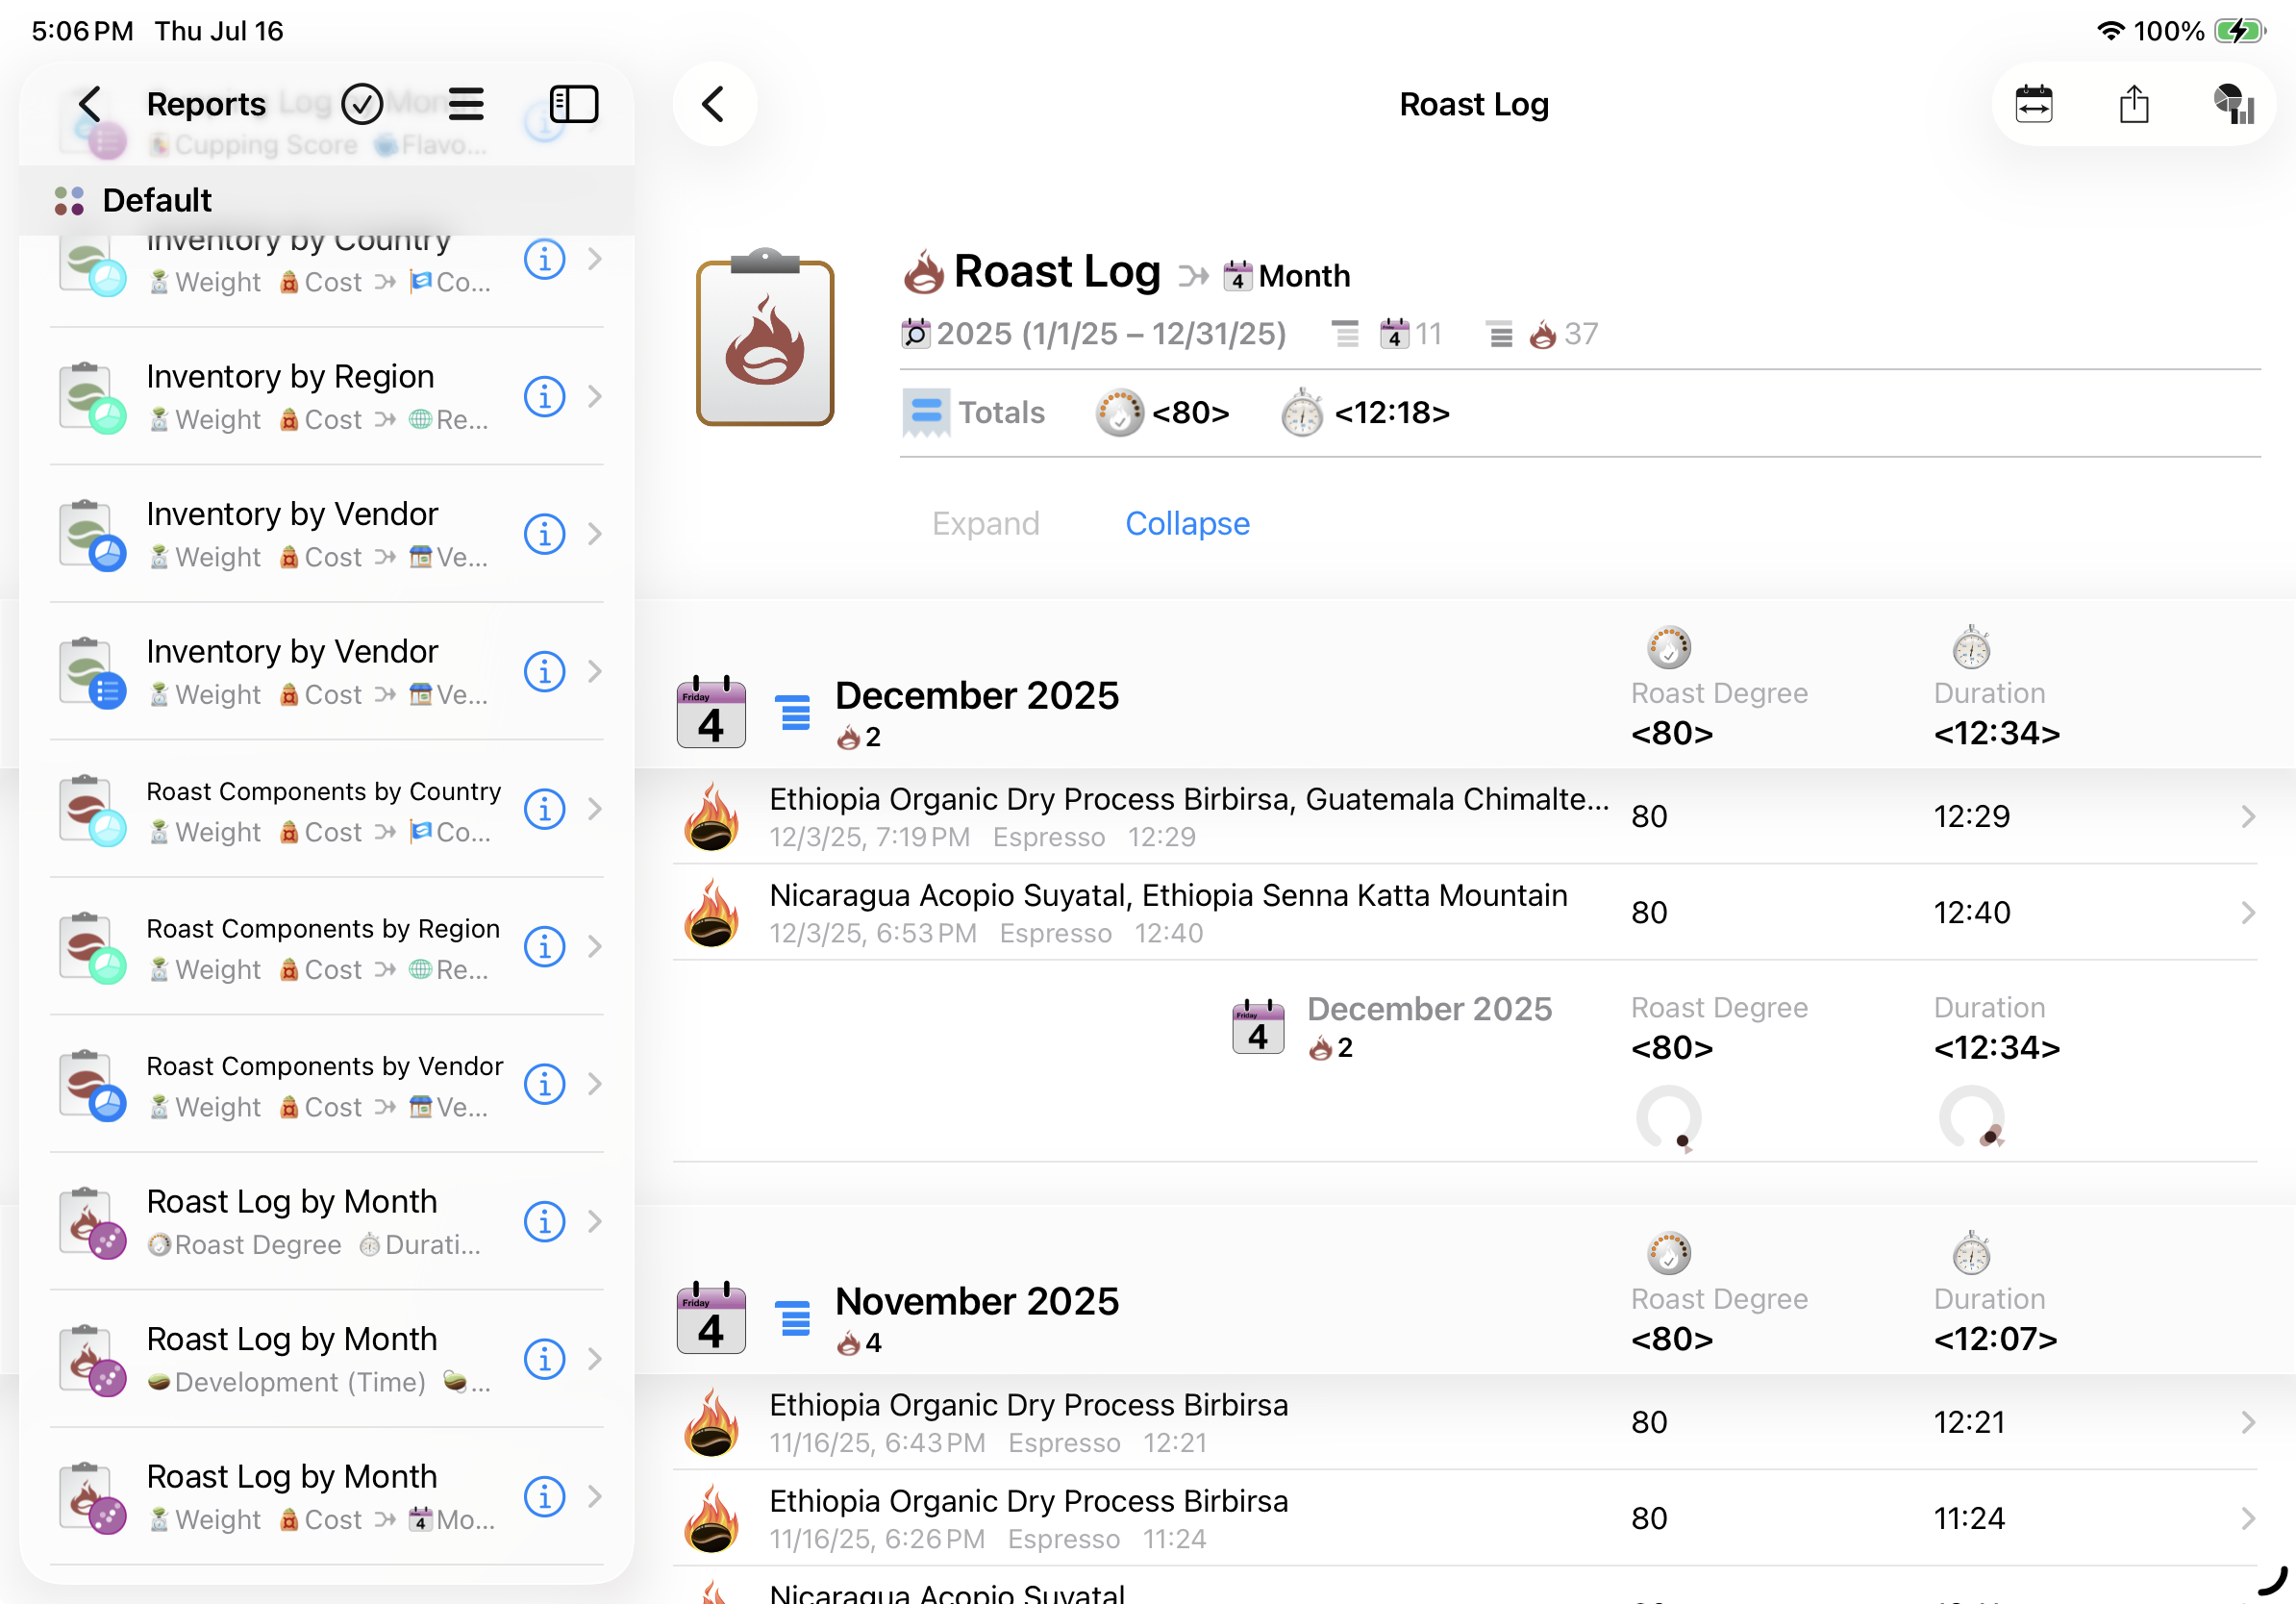
Saved Reports
This contains all of the reports that are saved in your database.
Roastmaster installs many default reports, to help you audit cost, quality and usage.
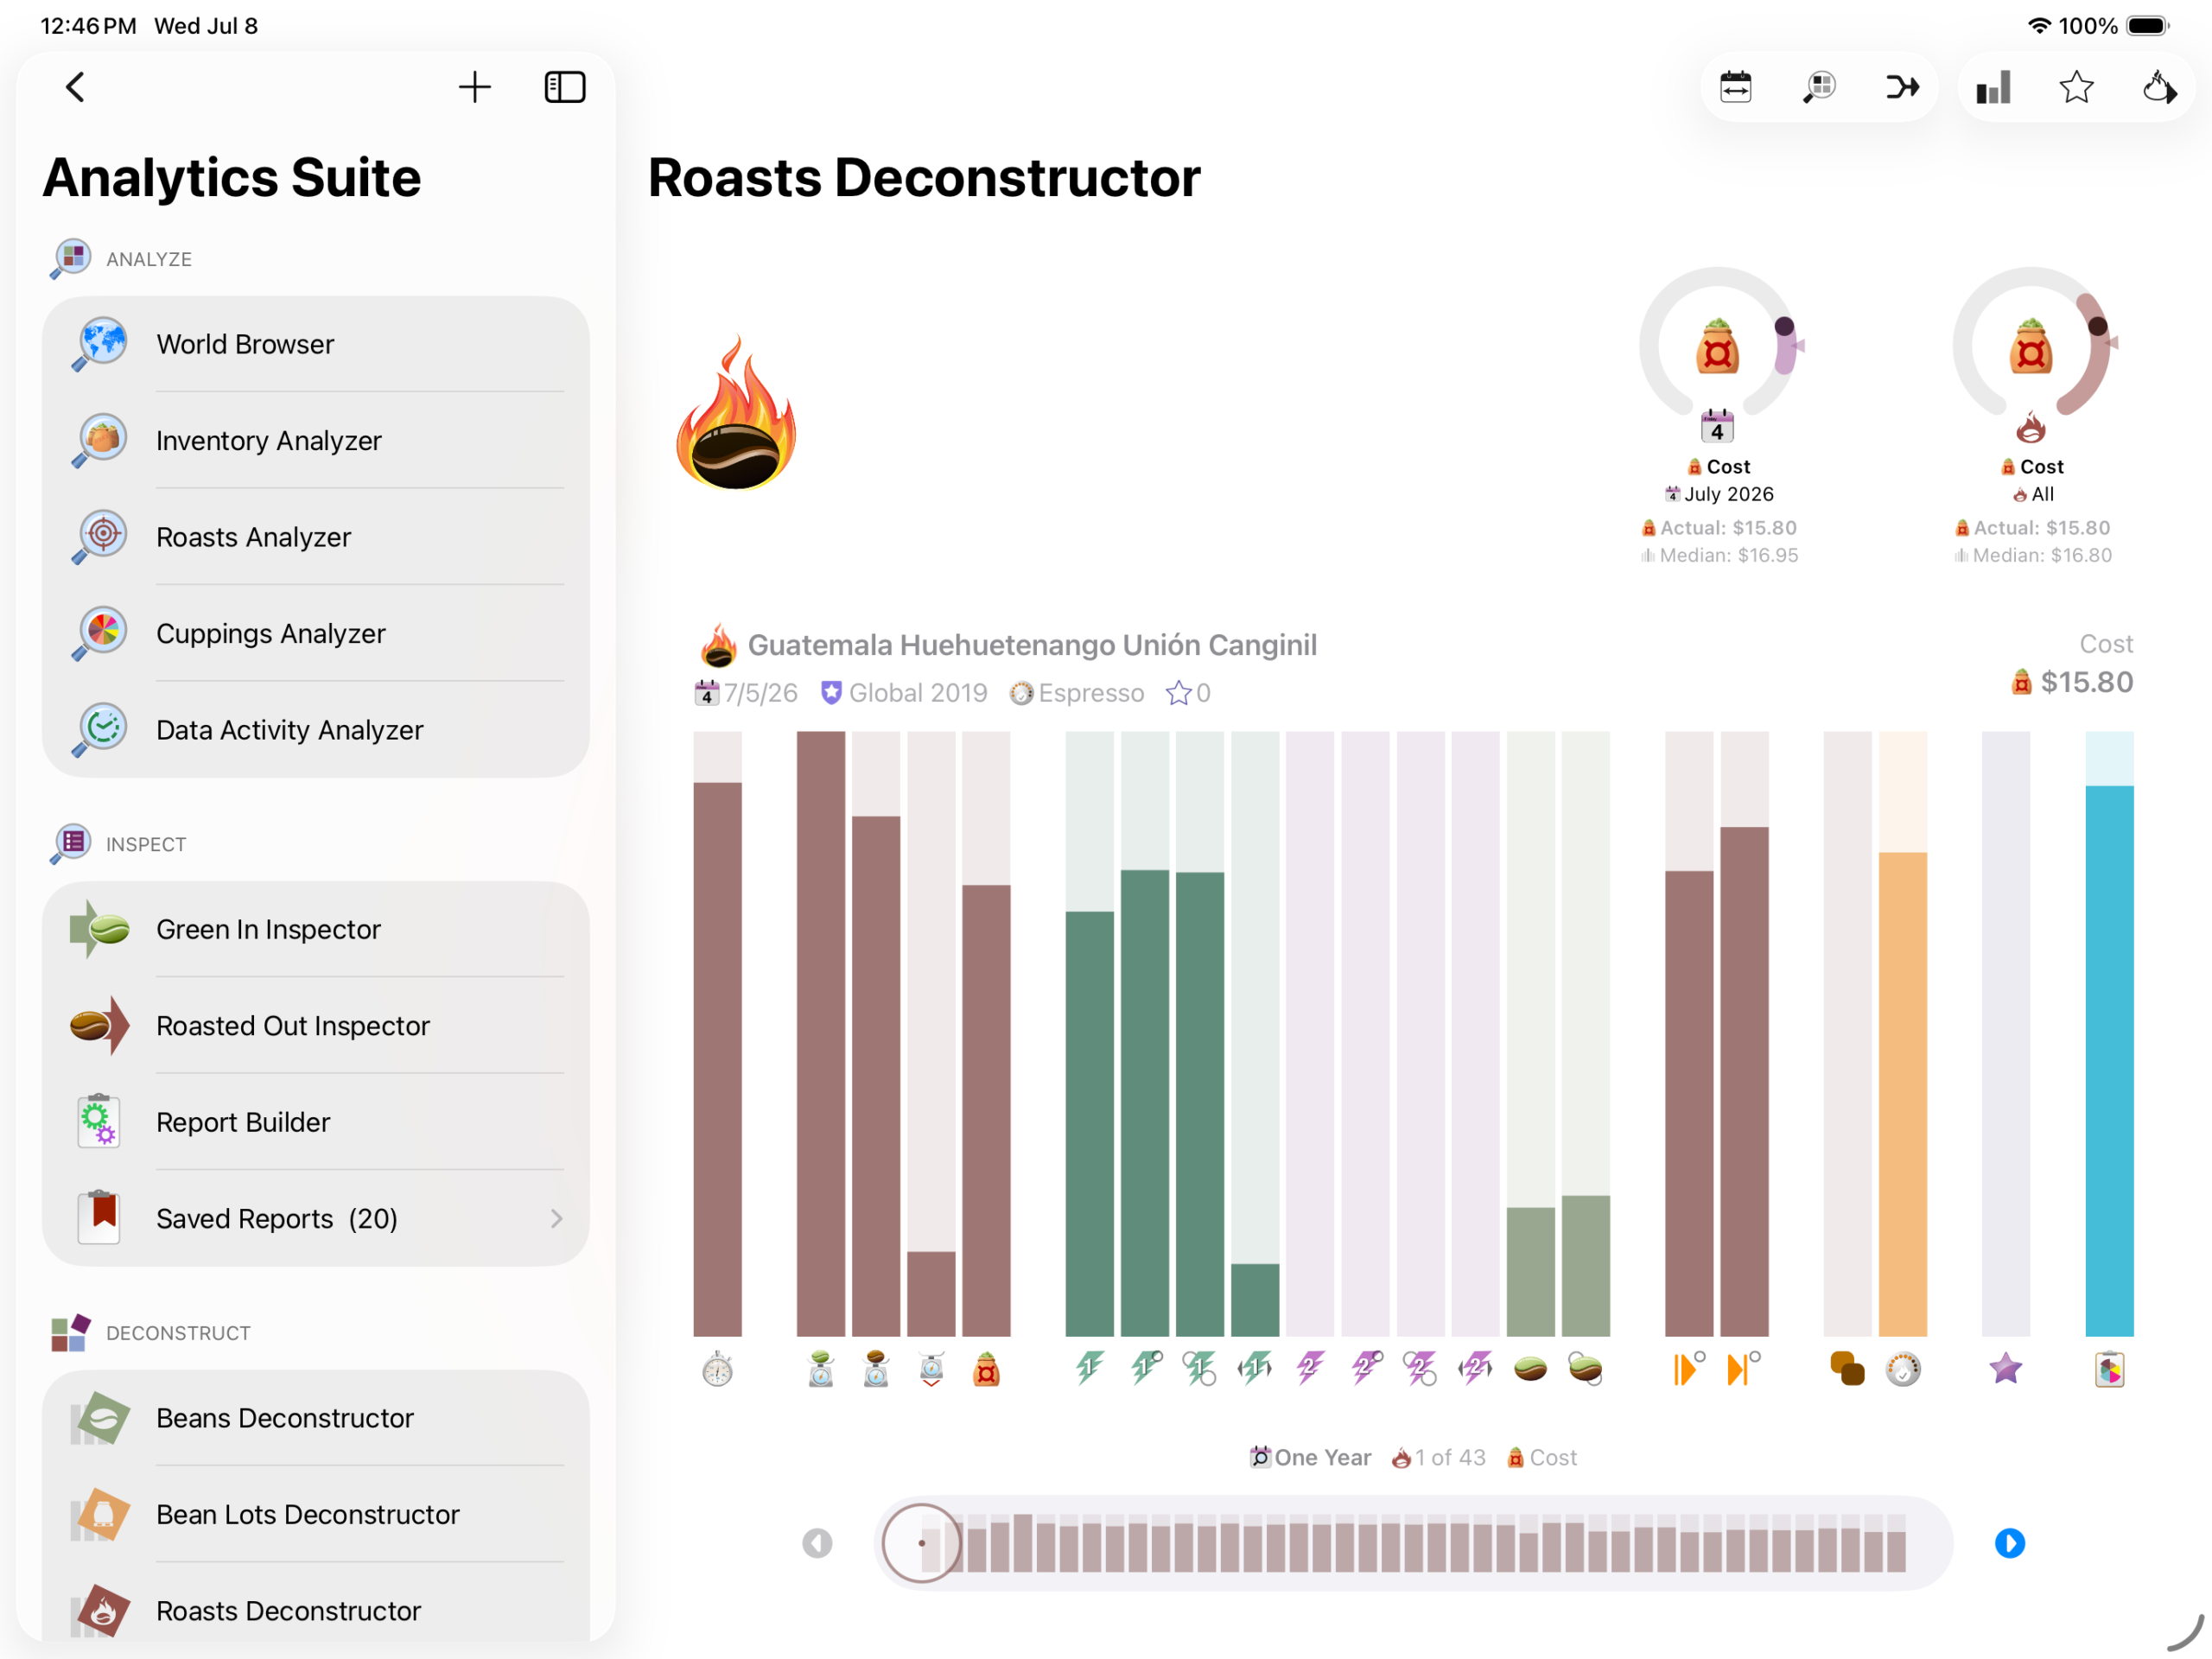
Deconstruct
Roastmaster’s Deconstruct features are the perfect macro lens. They show a big picture of the small details of your data.
They are designed to highlight patterns in your data in both visual and mathematical ways.
Each deconstruct browser focuses on a primary metric, and shows trends, ranges, and averages across the grouping range as well as the overall data set.