Cup Like You Mean It!
Good cupping habits will yield better coffee. Roastmaster makes it easy to quickly evaluate a single roast or an entire flight to keep your roasts on point.
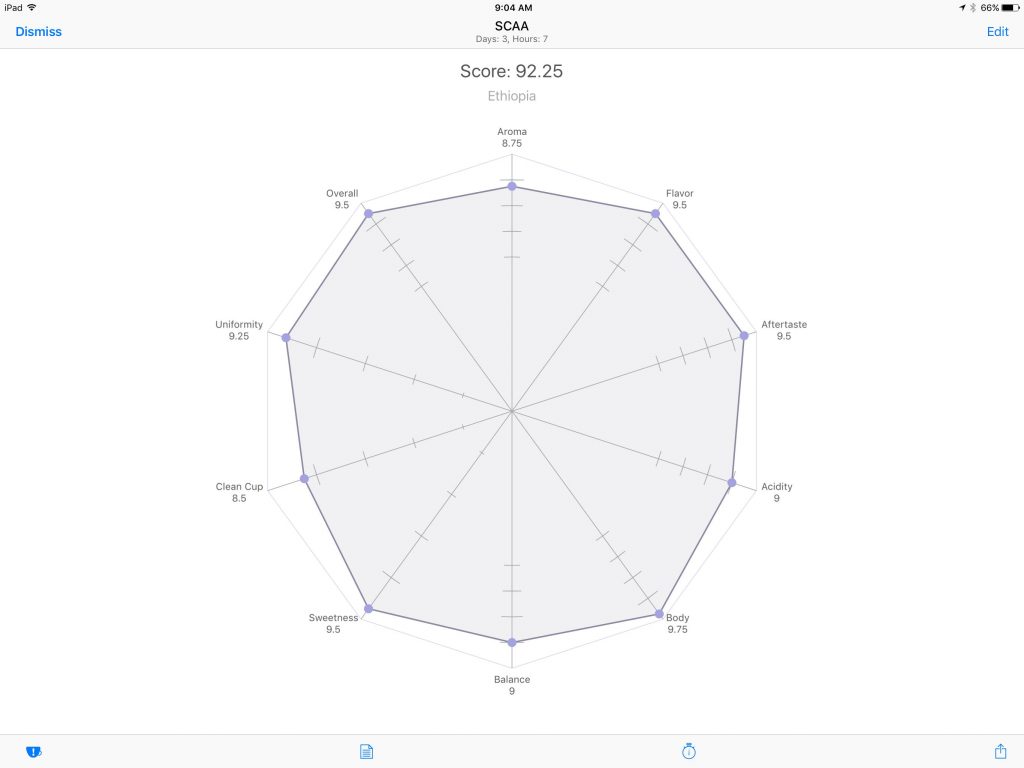
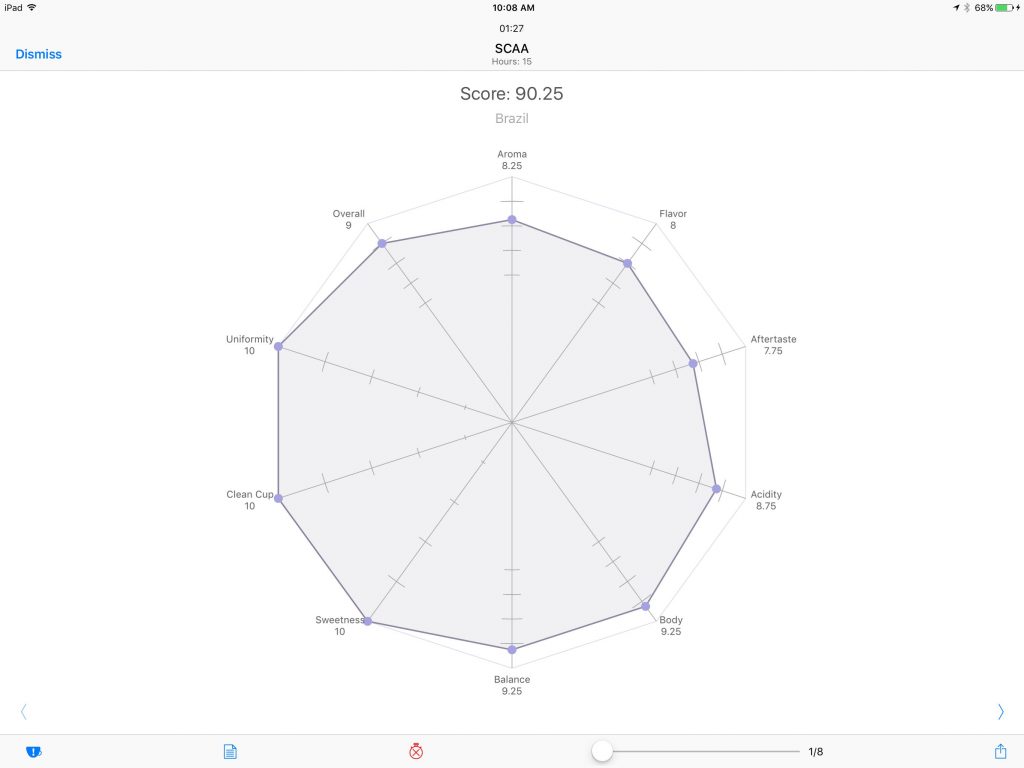
Evaluate Graphically with Interactive Spider Graphs…
It doesn’t get much easier than tap and drag. Evaluate a roast quickly, and visually see a cup’s strengths and weaknesses. Tap anywhere on the graph to set a value, or tap and drag a score to adjust it gradually while monitoring the overall score.
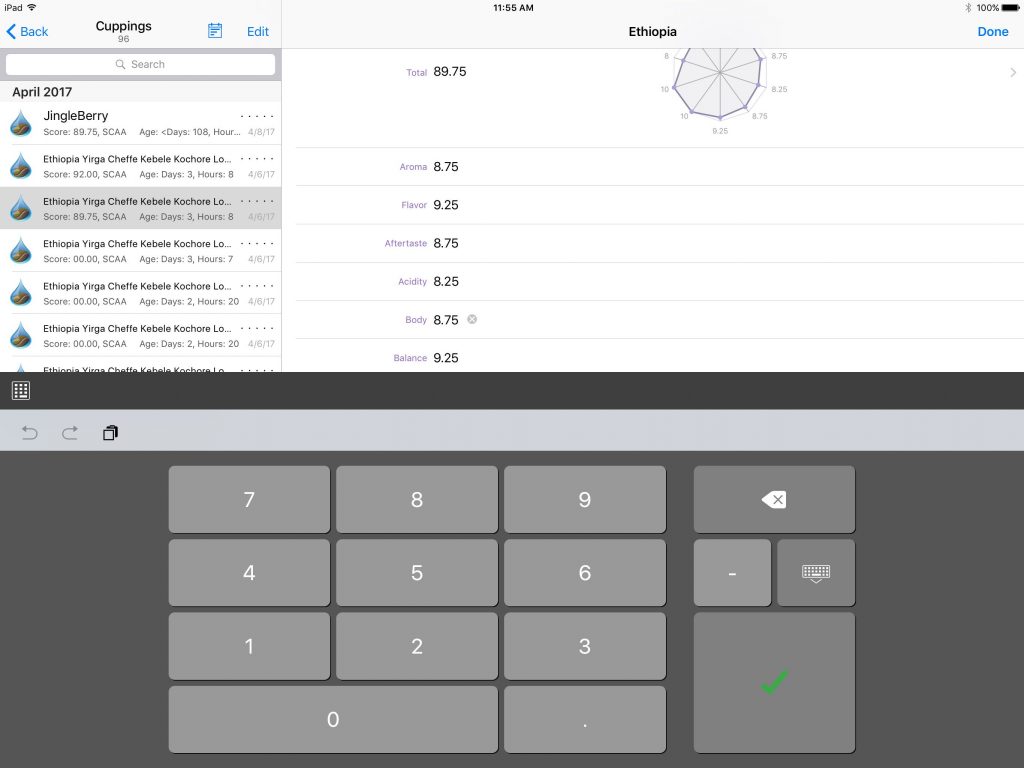
…Or Enter Data Numerically
Some folks just prefer a keyboard–Roastmaster will happily accommodate. You can also enter data form-style with a decimal keypad or external keyboard.
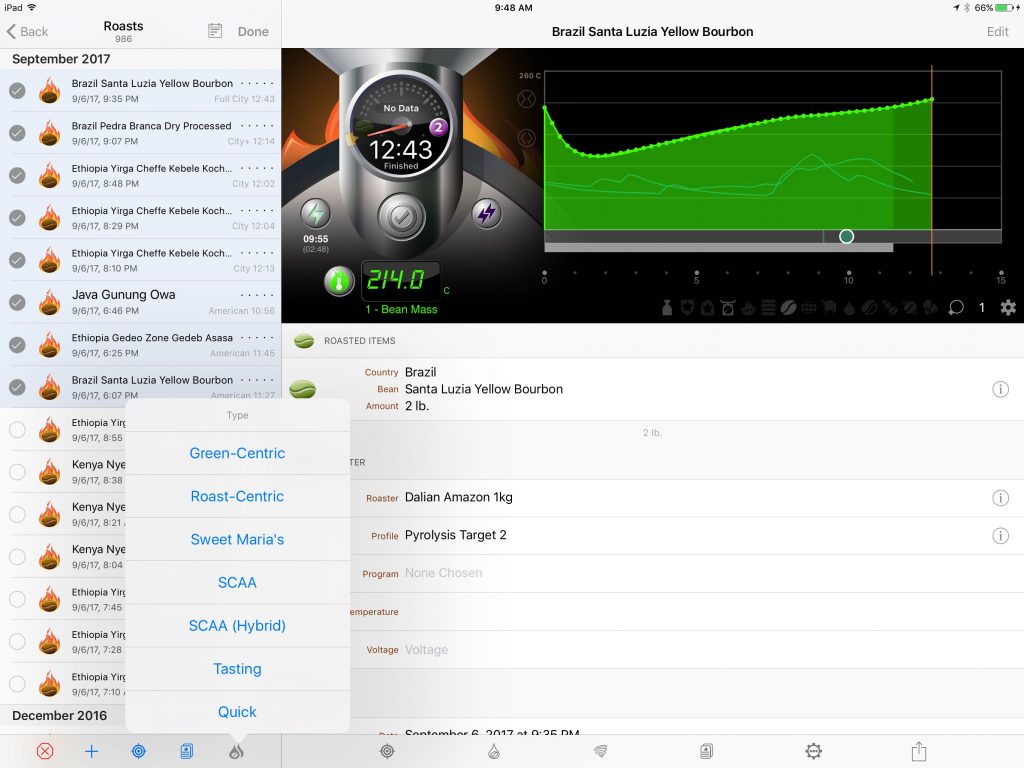
Fill the Cupping Table!
You can also select a range of roasts, and create a series of multiple cuppings. Choose a protocol that ranges anywhere from a quick score entry or informal tasting, to a full-blown traditional SCAA evaluation.
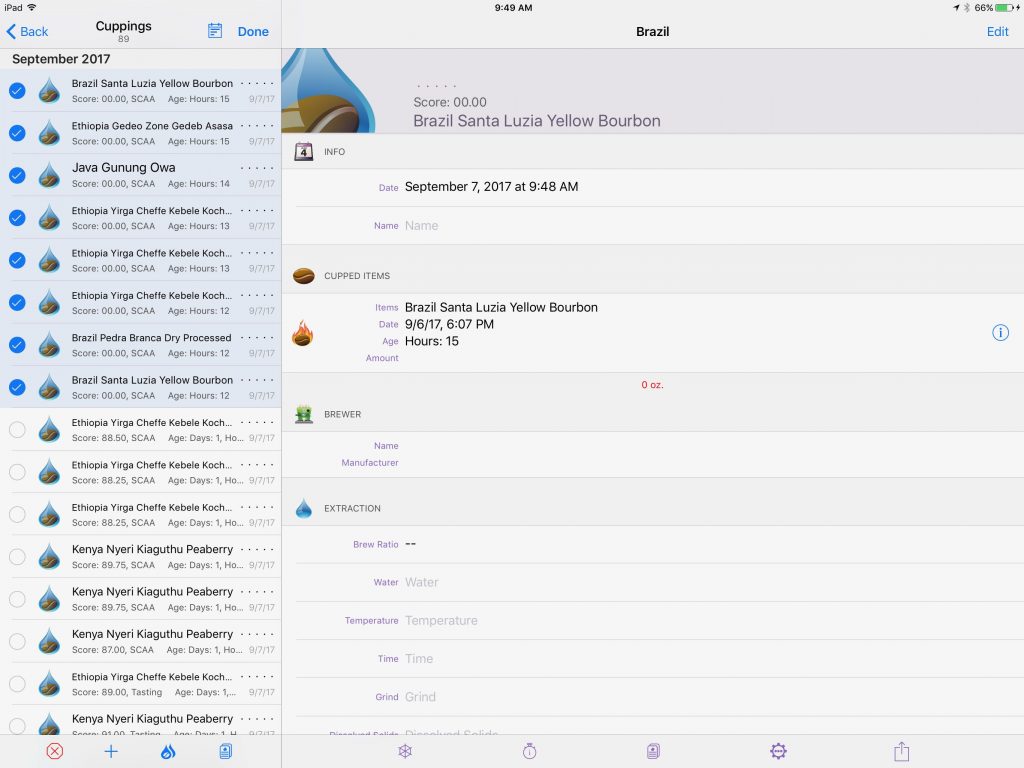
Slurp Away!
Tap cuppings one by one in the order they are laid out on the table. Then, tap the flight button to enter a dedicated spider graph entry screen.
Navigate Between Samples and Keep Time
A slider and navigation arrows provide easy means of switching samples in blind clipping style–with only the sample country being displayed. And, a dedicated timer keeps you on track with your protocol.
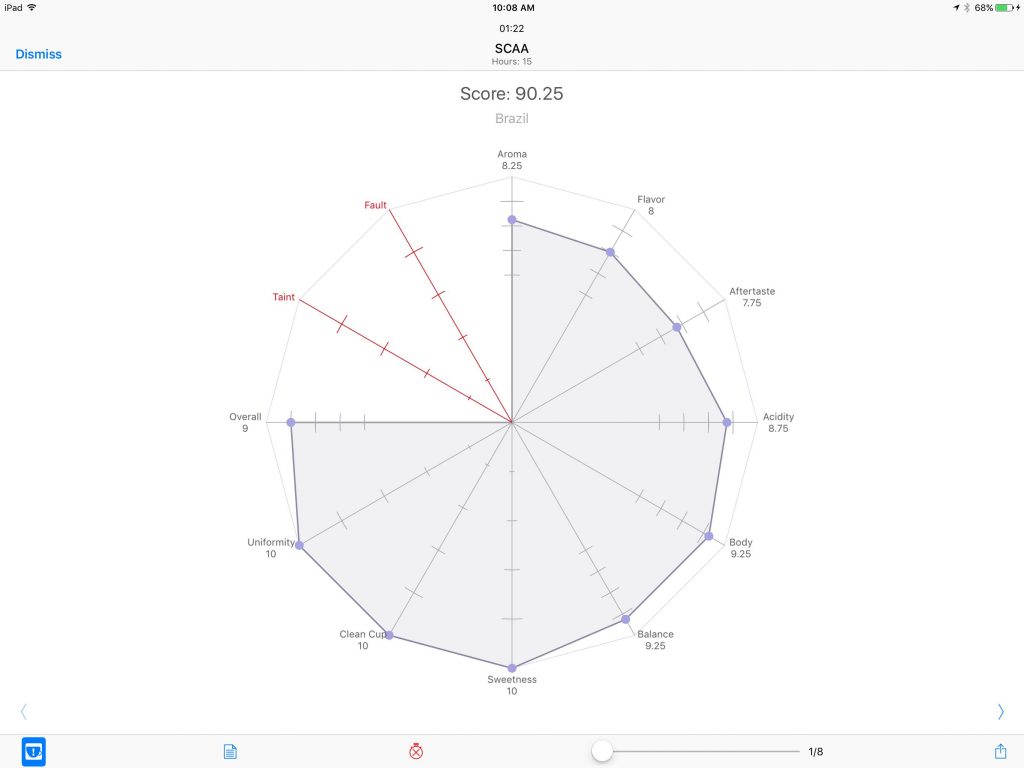
Taints and Faults–You Bet!
Sometimes, the coffee is more than the sum of its parts–or worse…less! Several of the included protocols provide a means to record taints, faults or a cupper’s correction value.
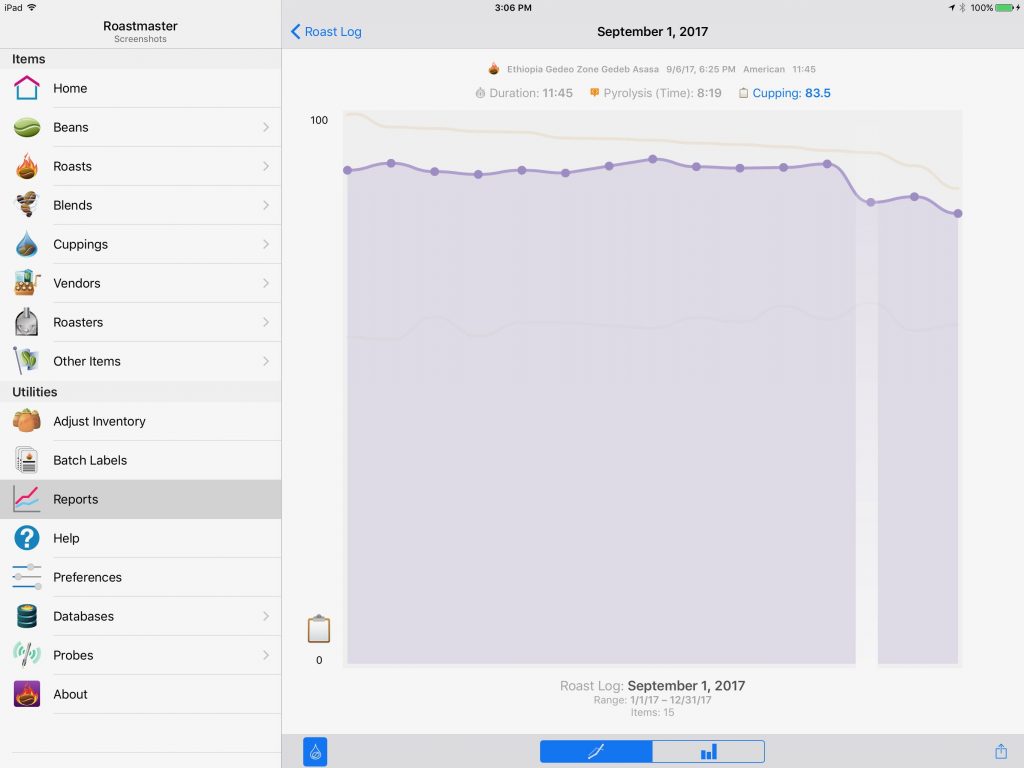
Put Your Data to Use and Spot Trends!
Want to easily see how duration, development, pyrolysis or any other variable is affecting the taste of your coffee? In any applicable report graph, just tap the cuppings button to instantly overlay associated cupping scores on top of your other metrics. Or, run a dedicated cupping report to spot trends in individual attributes, like acidity, body or balance.

